
Minimum Viable Observability: What Your SaaS Needs Before It Scales
Your first customers will report production problems in business language.
“Checkout is stuck.” “The dashboard is empty.” “The export never arrived.” “This started after the last release.”
If the engineering team can answer only with CPU charts and a stream of unstructured logs, the product is not observable yet. It may be monitored, but it cannot explain what happened to a specific customer request or whether the business workflow completed.
OpenTelemetry reached CNCF graduated status in May 2026. The project’s July graduation retrospective says its core traces, metrics, and logs signals have reached general availability and its governance, security, API stability, and production adoption were evaluated through the CNCF process. The announcement makes OpenTelemetry a sensible default instrumentation boundary for new systems.
That does not mean an early SaaS needs a large observability platform, dozens of dashboards, or a dedicated reliability team. It means the application should emit portable, structured evidence that helps a small team answer important questions quickly.
This is the minimum viable version I would design before growth turns every production issue into guesswork.
Observability Is an Answering System, Not a Data Collection Project
The useful question is not “Do we have logs?” It is “Can we explain this failed customer action?”
For a subscription SaaS, the first questions usually look like these:
- Is the service available for real user workflows?
- Which route, dependency, tenant, or release is responsible for failures?
- Did a background job start, retry, complete, or become stuck?
- Is latency affecting everyone or one plan, region, or operation?
- Did a user-visible action succeed even if one internal step failed?
- Can support find one request without asking an engineer to search several systems manually?
Write those questions before selecting a vendor. They determine which telemetry is worth collecting and which is noise.
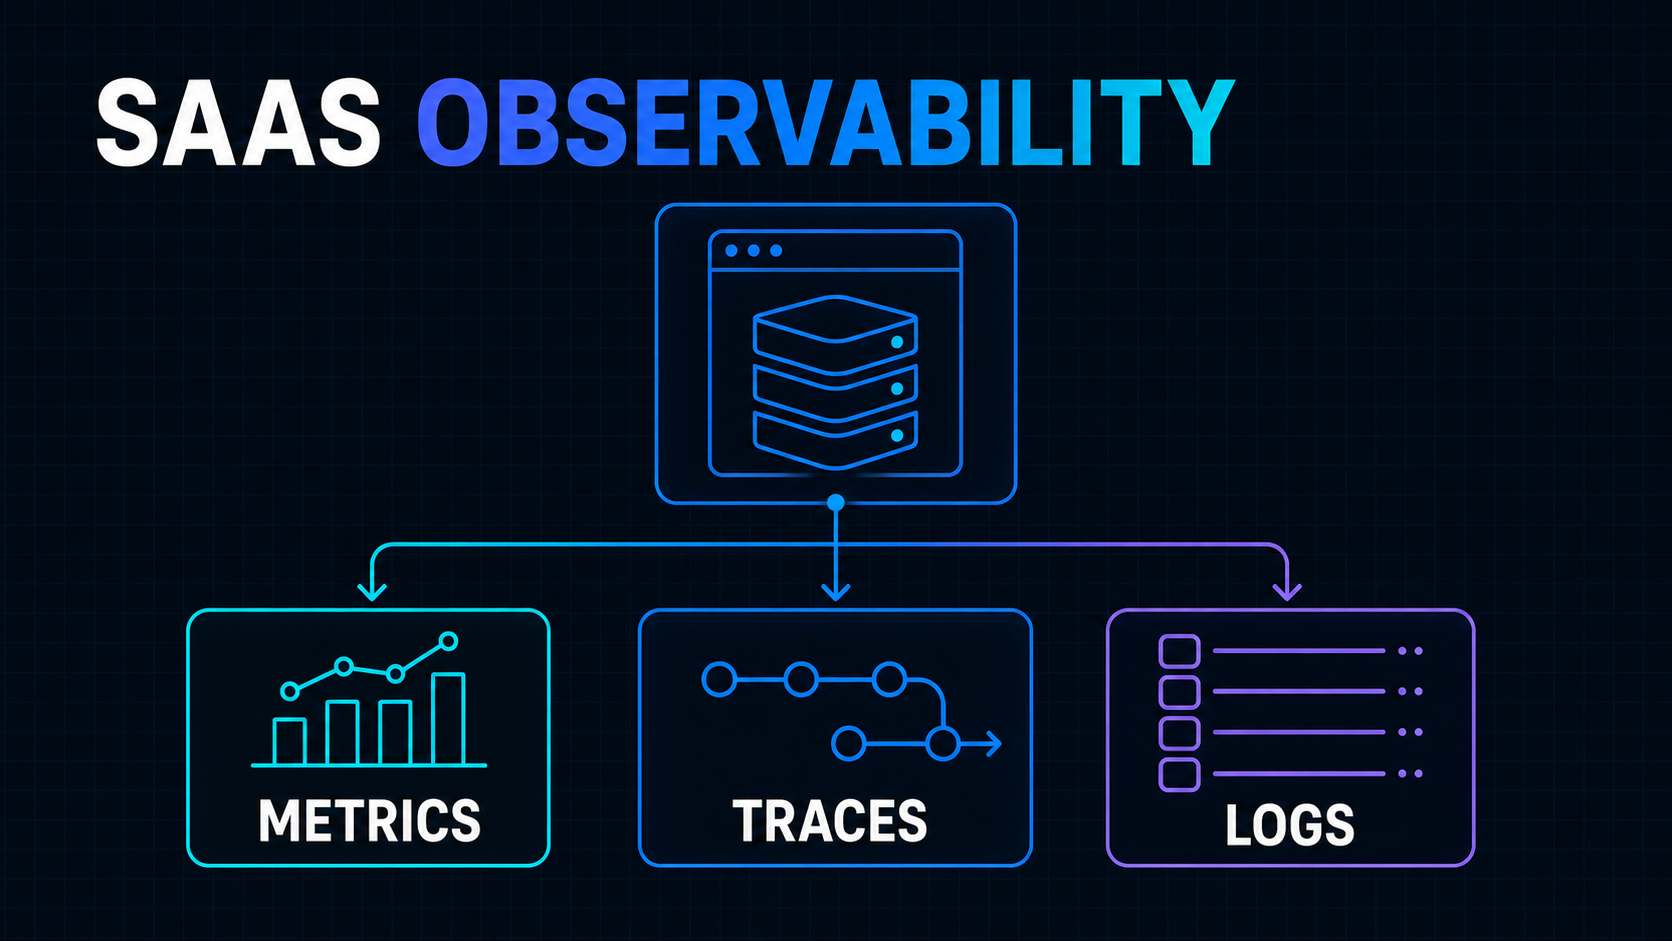
OpenTelemetry describes the main signals clearly: traces show the path of a request, metrics capture measurements over time, logs record events, and baggage propagates contextual information. Profiles remain under development or proposal rather than part of the minimum starting point. The official signal overview is a useful scope boundary.
The signals are complementary:
- Metrics tell you that the checkout failure rate increased.
- Traces show that payment-provider calls became slow.
- Logs explain that the provider rejected a particular request.
- Product events confirm whether the customer ultimately received the subscription they paid for.
Collecting all four without a shared request, operation, and deployment context still leaves the team stitching evidence together by hand.
Start With User Journeys and Service-Level Signals
Do not begin with every infrastructure metric your hosting provider exposes. Begin with three to five workflows that determine whether the product is usable.
For example:
- Sign in and load the workspace.
- Create the product’s primary record.
- Complete a paid or quota-limited action.
- Run the main background workflow.
- Export, notify, or integrate with an external system.
For each journey, define a success event, a failure event, and a duration. That gives you a small set of service-level indicators:
workspace_load_success_rate
record_create_duration_ms
paid_action_failure_rate
background_job_age_seconds
notification_delivery_success_rate
These names are illustrative, not a universal schema. The important decision is to measure the outcome the customer cares about rather than only the health of the process that attempted it.
A server can return 200 while scheduling a job that never runs. A payment endpoint can return 500 after the provider accepted the charge. A dashboard can render successfully with stale data. Infrastructure availability and workflow correctness are related, but they are not identical.
This belongs in the same conversation as a broader production-ready SaaS MVP: readiness includes knowing whether the product is working after deployment, not merely getting the deployment to finish.
Give Every Request a Correlation Spine
The smallest useful observability architecture has a shared spine that follows work across boundaries.
At the start of a request, create or accept a valid trace context and assign a request ID. Attach stable operational context such as:
- service name;
- deployment environment;
- release or commit identifier;
- route template, not the raw URL;
- operation name;
- region when it changes behavior;
- tenant identifier in a controlled, non-sensitive form.
Then propagate the context into database calls, outgoing HTTP requests, queues, and workers. A job created by request req_123 should retain a trace or correlation link when it runs later.
For Next.js applications, the framework already exposes an instrumentation.ts convention and documents OpenTelemetry support, including default server, route, render, and fetch spans. Its current guide also shows how to add custom spans around application work. The Next.js OpenTelemetry documentation is a better starting point than wrapping every function manually.
A custom span should name a business operation, not repeat an implementation detail:
return tracer.startActiveSpan("subscription.activate", async (span) => {
  span.setAttribute("subscription.plan", planKey)
  span.setAttribute("operation.source", "checkout")

  try {
    return await activateSubscription({ tenantId, customerId, planKey })
  } catch (error) {
    span.recordException(error as Error)
    throw error
  } finally {
    span.end()
  }
})
Do not attach email addresses, access tokens, prompts, full request bodies, or unrestricted database IDs because they are convenient during debugging. Telemetry is copied, retained, queried, and sometimes exported to third parties. Treat its schema as an application data model with its own privacy boundary.
If tenant context is part of your debugging model, use the same trusted context described in the SaaS tenant-isolation blueprint. A client-supplied tenant label is neither an authorization control nor trustworthy diagnostic evidence.
Keep Metrics Low-Cardinality and Decision-Oriented
Metrics work well for rates, totals, distributions, and current values. They work badly as a database of unique customer activity.
A practical first set might include:
| Metric | Useful dimensions | Avoid | |---|---|---| | Request count and errors | route template, method, status class | raw URL, user ID | | Request duration | route template, region | request ID | | Queue age and depth | queue name, job type | job ID | | Dependency duration | dependency name, operation | full destination URL | | Business workflow outcomes | workflow, result, plan tier | customer email |
High-cardinality attributes create a new time series for many unique combinations. OpenTelemetry’s current metrics guidance explains that this consumes aggregation state and can produce overflow that removes useful dimensions from later measurements. It specifically calls out values such as user IDs and raw URL paths as dangerous metric attributes. The cardinality documentation is worth using as a code-review rule.
Put unique request IDs on traces and structured logs, where they help investigate one event. Put bounded dimensions such as route templates, status classes, job types, and plan tiers on metrics, where they help compare many events.
This distinction controls both memory and vendor cost. More importantly, it keeps dashboards legible enough to support decisions.
Make Logs Structured, Sparse, and Correlated
Good logs describe meaningful state transitions.
For a background export, useful events could be:
{
  "event": "export.completed",
  "requestId": "req_123",
  "traceId": "4bf92f...",
  "jobType": "workspace_export",
  "attempt": 2,
  "durationMs": 1842,
  "result": "success"
}
The corresponding failure should include a stable error code, the failing dependency, retry decision, and safe exception details. It should not dump the full customer dataset being exported.
Avoid logging every function entry, every successful database query, or the same exception at four layers. Those events increase ingestion volume while making the causal sequence harder to see.
Choose one layer to own the final error event. Let lower layers add structured context to the trace or return typed errors. Log business state transitions where they become durable: queued, started, retried, completed, cancelled, or dead-lettered.
Add a Collector When It Solves a Real Boundary
An OpenTelemetry Collector can receive, process, and export telemetry independently of the application. It provides a useful control point for batching, retries, encryption, filtering, and routing to one or more backends.
But it is not mandatory for the first proof of value. The OpenTelemetry project explicitly notes that direct-to-backend export can work for development and small-scale environments, while recommending a Collector more generally when teams need those processing and reliability features. The Collector guidance supports a staged decision.
Start with direct export when:
- there is one application and one backend;
- traffic is modest;
- the exporter has safe timeouts and bounded buffering;
- losing some telemetry during a backend outage is acceptable;
- the team needs to validate its schema before operating more infrastructure.
Add a Collector when:
- several services need consistent filtering and routing;
- the application should not hold vendor credentials;
- retry and batch policy should be outside the request process;
- telemetry must be redacted before leaving your network;
- you need to change or mirror backends without redeploying every service.
Keep failure isolation explicit. Telemetry export must never make a customer request wait indefinitely. Use short export timeouts, bounded queues, and a drop policy. If the observability backend is unavailable, the product should continue serving traffic and report the telemetry pipeline failure through a separate health path.
Design Privacy and Cost Controls Before Volume Arrives
Telemetry can contain personal data, authorization context, network structure, query text, and customer content. The OpenTelemetry security guidance warns that Collector deployments must protect sensitive information, prevent tampering, and account for denial-of-service risk. Its security overview is a reminder that observability infrastructure is part of the production attack surface.
Create an allowlist for attributes rather than collecting everything and planning to redact it later.
At minimum:
- remove authorization headers, cookies, tokens, and secrets;
- exclude request and response bodies by default;
- normalize routes before recording them;
- hash or map tenant identifiers when operators do not need raw IDs;
- define retention by signal and environment;
- restrict who can search customer-correlated telemetry;
- test redaction with realistic error cases;
- cap span, log, and metric volume before an incident multiplies it.
Sampling is a cost control, but careless head sampling can remove the rare failures you most need. A modest SaaS can begin by retaining all error traces, keeping traces for critical workflows, and sampling a smaller portion of routine successful traffic. Document the rule and verify that an incident still leaves enough evidence to investigate.
Alerts Must Point to Customer Impact and an Owner
An alert is useful only when someone can decide what to do next.
Page or notify on symptoms such as:
- a sustained rise in failed primary workflows;
- latency beyond the user-facing objective;
- queue age exceeding the promised completion window;
- dependency failure consuming the retry budget;
- scheduled work not running at all;
- telemetry disappearing after a deployment.
CPU, memory, connection pools, and disk are valuable diagnostic signals. They should page only when they reliably predict or explain customer impact. Otherwise, keep them on dashboards for investigation.
Every alert needs an owner, severity, evaluation window, link to the relevant dashboard, and first three checks. Test it by forcing a safe failure in staging. If nobody knows how to trigger or resolve an alert, it is an untested assumption.
The same discipline improves performance work. A trace can identify a slow dependency, but the fix still requires measuring user-facing behavior and choosing the right bottleneck, as described in the Next.js performance guide.
A Seven-Step Minimum Viable Observability Plan
Use this sequence for one production service before standardizing it across the company.
- Choose three critical journeys. Name their success, failure, and duration events in customer language.
- Create the correlation spine. Propagate request, trace, operation, release, environment, and trusted tenant context across HTTP and background work.
- Instrument the boundaries. Start with incoming requests, database calls, external APIs, queues, and the main business operation.
- Define a small metric set. Use bounded attributes and add a review rule that rejects raw URLs, request IDs, and user IDs on metrics.
- Standardize structured events. Log durable state changes and one final error with safe context; remove duplicate noise.
- Add three actionable alerts. Cover availability, latency, and stuck asynchronous work; assign an owner and test each alert.
- Run a production-game-day check. Deploy a known version, introduce a safe failure in staging, trace one affected request, confirm redaction, and estimate daily telemetry volume.
After one release cycle, review which signals answered real questions. Remove telemetry nobody used. Add detail only where an investigation exposed a blind spot.
Build the Evidence Before the Dashboard Collection
OpenTelemetry’s graduation reduces the risk of choosing a portable instrumentation standard. It does not decide what your team needs to observe.
For an early SaaS, the valuable architecture is deliberately small: critical user journeys, correlated traces and logs, low-cardinality service metrics, safe attribute rules, and alerts tied to customer impact. A Collector and more advanced signals can arrive when scale creates a real boundary for them.
The test is straightforward. When a customer reports that an important action failed, can one engineer find the request, follow its dependencies, identify the release and tenant context, see whether background work completed, and explain the outcome without guessing?
If not, add the missing evidence before adding another dashboard. A focused production-readiness upgrade should leave the team with faster answers, not merely more telemetry.
Working on a SaaS that's starting to feel fragile?
Talk to an engineer about the parts that break first — without rewriting what already works. We'll recommend focused support or a compact team based on your scope.
Talk to an Engineer